Stats Overview for the CUDOS Ecosystem
The Stats page offers real-time and historical insights into the usage of CUDO and CUDOS hardware solutions.
Navigating the Dashboard
The Stats dashboard is designed to help users easily explore platform and ecosystem activity. Here's how to navigate it.
The dashboard is organised into three tabs:
- All Data: Shows metrics across all usage types.
- On-Demand: Shows metrics specifically related to on-demand deployments.
- Private Cloud Clusters: Shows metrics from bigger cluster environments.
- Transaction Records: Shows on-chain records of ecosystem actions, payments and USDC flows through the ASI chain in Cosmos.
Below is a description of the different sections of the main dashboard.
Timeframe Selection
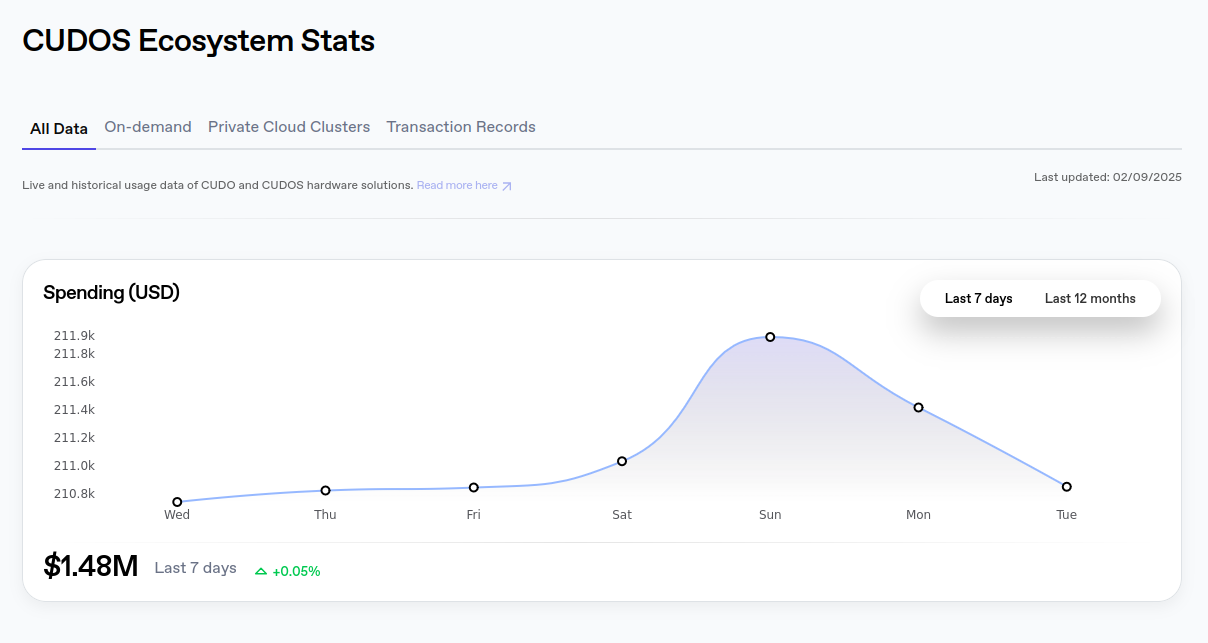
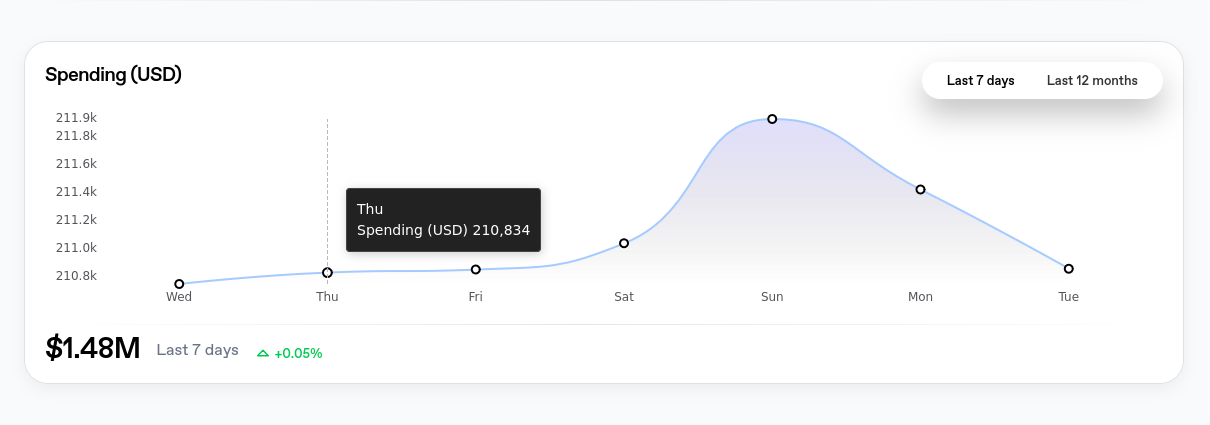
Use the range selectors at the top of each metric to customise the period for which data is displayed. Available options include viewing data from the past 7 days or the past 12 months.
Interactive Charts
Hover over any data point in the charts to reveal the exact figure and date.
Key Metrics Explained
The CUDOS Intercloud Stats page presents several key metrics that provide insights into platform usage and performance. Here’s a breakdown of each metric:
Spending (USD)
The total amount spent by users over the selected timeframe. This metric provides insight into the financial growth and adoption.
GPU Hours
The total number of GPU compute hours consumed across the platform. This metric highlights the demand for high-performance, GPU-intensive workloads.
CPU Hours
The total number of CPU compute hours consumed. This indicates the volume of general-purpose processing being utilised across deployed resources.
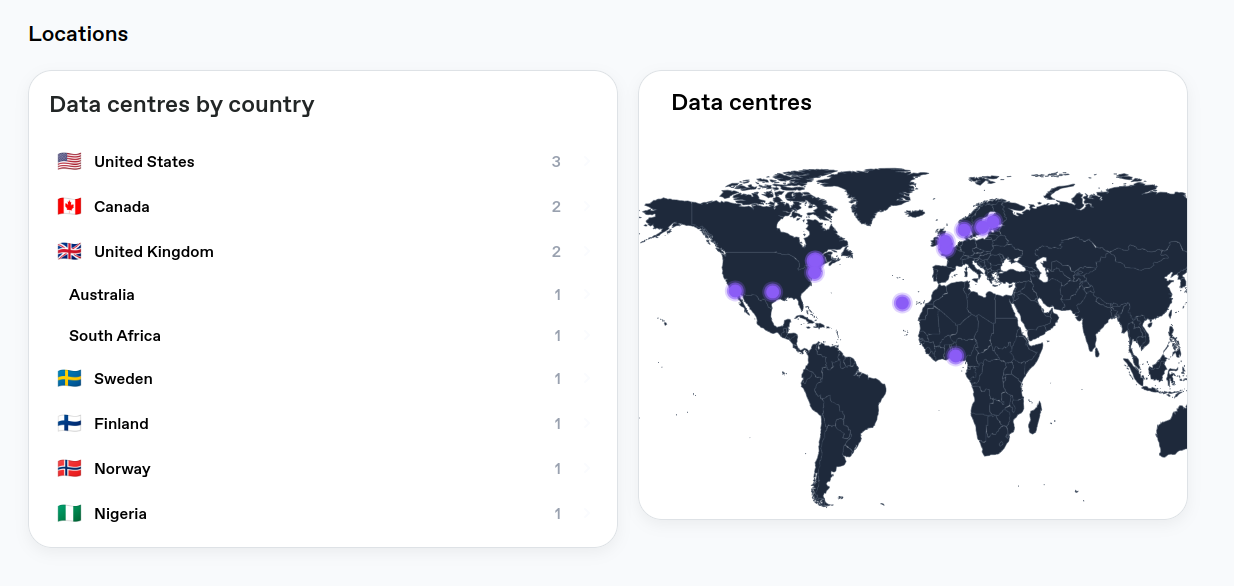
Locations
The number of active data centers by country, that are contributing resources to the CUDOS Intercloud. There's an interactive map visually displaying the locations of these data centers.
Other Metrics
Additional important indicators include:
User Registrations: The total number of users who have registered on the platform, showing community growth.
VMs Deployed: The total number of Virtual Machines deployed, showing platform usage and engagement.
Memory Usage: The total memory consumed across deployed instances, providing insight into application resource demands.
Storage Usage: The total disk storage consumed, showing storage needs across deployments.
🎓Want to learn more?
You can learn more about this by joining our Discord or Telegram.